


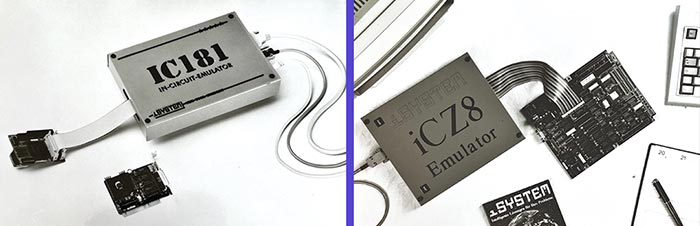
Figure 1: In-circuit emulation at the end of the 1980s (© iSYSTEM)
In the 1990s, there were basically two tool-based solutions for debugging embedded software on real hardware: The monitor debugger, i.e., a piece of software that was programmed in the memory of the embedded system and reacted to requests of a debugger software from outside. And the in-circuit emulator, a (large) piece of hardware that replaced and emulated the microcontroller/processor located in the target hardware by adaptation.
The monitor debugger solution was cheap and fulfilled basic debugging functions; the in-circuit emulator solution was very expensive, complicated to use, and the adaptation was often shaky and error-prone. In return, the developer received full transparency and access to all buses of the microcontroller/processor. Both, timing measurements and code coverage analysis were already possible at that time. However, semiconductor manufacturers had to develop a special, so-called emulation chip with additional pins for this purpose. A crucial cost factor for all involved.
The increasing miniaturization of semiconductors and the introduction of on-chip debug interfaces had a big impact on the architecture of a debugger as a development tool itself. More and more functionality that was previously realized in hardware was now implemented in software. The development environments and debugger software became more powerful, the hardware smaller with increasing performance in terms of bandwidth and speed. However, the basic use cases of debugging are still the same today.
Hardware Debugger in Development
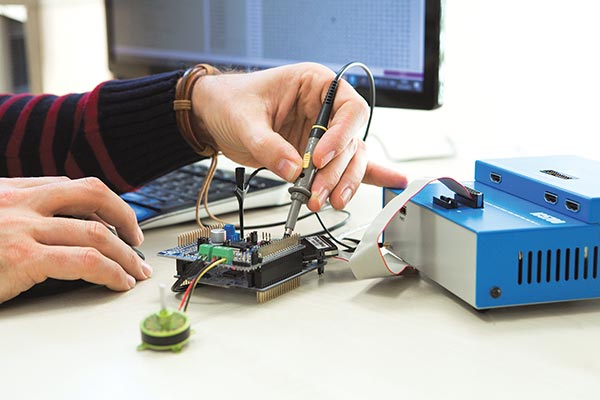
Figure 2: Hardware debugging – an embedded software developer’s daily business. (© iSYSTEM)
From printf to “just” flash to breakpoints, real-time watches, and step over, this is how you could briefly describe debugging. In principle, debugging is used for development and troubleshooting in driver development, board/hardware bring-up, boot processes and much more as a standard method for “low-level”, i.e., hardware-related, development. A debugger is quickly taken out on the desk to flash the software onto a target hardware, to start the execution or to stop it at a certain point in the code by means of a breakpoint, to check memory areas and registers or to manipulate them for testing, to read out the call stack and so on. In terms of application, it’s simple, understandable and in principle what most developers understand by debugging. Most of the time, one doesn’t have the time to deal intensively with the debugger itself to possibly discover “the holy grail of debugging”, additional features that could ultimately save a lot of time in debugging and testing. For instance, and in this context, an underestimated technique is tracing. It provides insights into the software’s execution without affecting the runtime behavior. The developer thus gets a real image of the software execution on the hardware. Sporadically occurring errors and bottlenecks in the software can be uncovered. This is just one example of many alternative use cases of a debugger.
Microcontrollers, Processors and SoCs
The evolution of debugging has been accompanied with the miniaturization of semiconductors, their increasing complexity and speed. Over the last 15 years, the embedded industry, in particular the automotive industry, introduced many additional functions into their products to meet current and future environmental regulations, to reduce the number of car accidents in general, to develop and produce vehicles more efficiently by distributing functionality across multiple electronic control units (ECUs) instead of developing a dedicated ECU by function, and to differentiate themselves from the competition. To achieve all of this, the automotive industry needed semiconductor manufacturers which meet their requirements by developing and producing more compact and faster microcontrollers.
This was the birth of embedded multicore microcontrollers, controllers with two or more cores. The shift from single to multicore architectures in ECUs came with new challenges for everyone. Embedded software tool vendors were confronted with new issues, from how to easily access all the cores of a multicore ECU to how to distribute embedded and legacy software on different cores that run most efficiently while maintaining high performance. The traditional way of developing embedded software was already being questioned at this point.
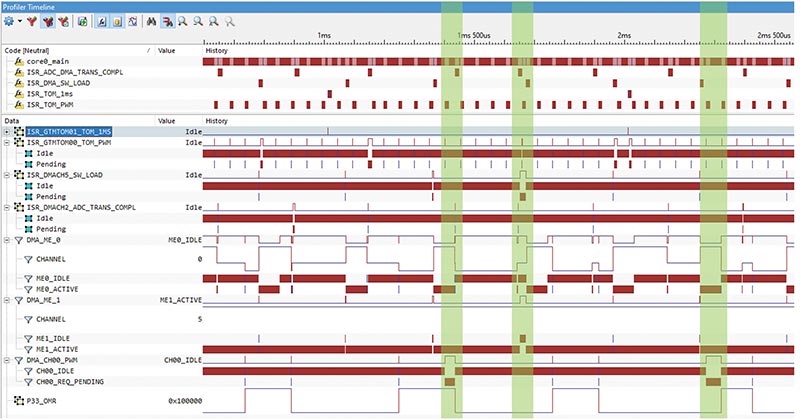
Figure 3: The winIDEA Analyzer from iSYSTEM; on the left the recorded objects and on the right their temporal correlation. (© iSYSTEM)
With the introduction of high-performance/-computing platforms and many-core systems, even more complex processor architectures are now used for the development of high-sophisticated applications. What role does debugging still play here? In principle, it remains with the basics. In addition to a microcontroller’s internal flash components, SoC external flash components must be operated as well. Debuggers first help to control the boot process and then, in the next step, to closely examine the individual parts and cores of these processors as well as the software running on such devices.. In addition to standard debugging functions, and due to the increasing complexity of these software systems, analysis options such as timing analysis, function profiling or CPU load measurement are increasingly being used (Fig. 3). Prerequisites for this are the availability of trace interfaces on the semiconductor used and a corresponding debugger whose software implements such functions.
The technical developments in the semiconductor industry are changing the software development process and, in turn, the debugger as a fundamental tool to a process tool.
Software Development Processes and Standards
Distributed development teams, an increasingly complex code base, growing functional requirements, standardization, and time pressure: even in the development of embedded software, the challenge to bring a reliable and safe product to market in the shortest possible time can only be met with a higher degree of abstraction and automation.
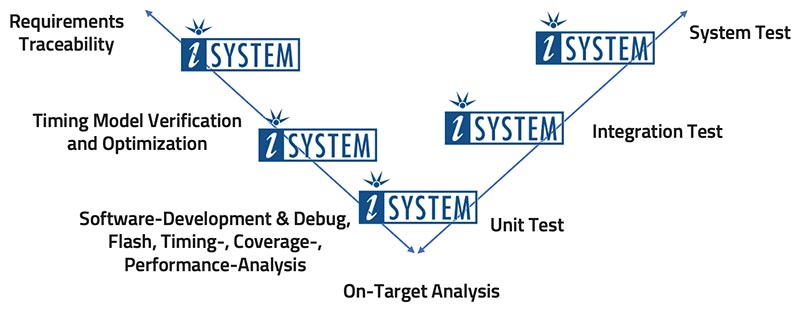
Figure 4: Today, debuggers offer APIs that realize development and test processes with smooth and automated tool transitions. (© iSYSTEM)
Development tools in the classical sense therefore must be more versatile than ever. Previously used exclusively by microcontroller experts as a hardware-related development tool, a debugger can now increasingly be found in a wide variety of software development situations. The debugger is still the connection to the actual target hardware via standard debug interfaces with the purpose of developing and testing embedded software as close as possible to the actual hardware. In addition to simply interfacing to a target hardware, debuggers provide more advanced debugging functionality including testing capabilities as well. Here, the developer has the possibility to trace the execution of the running software. For this purpose, the program state can be inspected, and the execution of the program can be stopped under certain conditions. This is done with minimal or no influence on the software being tested. Professional debug solutions additionally enable the recording of processes in the software in real time (tracing), the logging of execution times in the range of clock cycles as well as the assessment of the processed parts of the software relevant for testing (code coverage).
For a customer to be able to flexibly use all this functionality, the debugger manufacturers provide generic interfaces (API) that enable the integration of these tools into the customer’s development and test process (Figure 4). These interfaces must be suitable for solving a wide variety of tasks (developing, testing, verifying, and validating software and hardware). The standard here is the support of programming (C, C++, C#, Java etc.) and scripting languages (Python etc.) for “remote control” of the development tool from another (also customer-specific) application. Basically, parts of the process can then be automated both during development and testing.
Furthermore, today’s debuggers provide so-called “mini-HIL” functionalities (hardware-in-the-loop, measurement, and stimulus modules for tests) to generate or measure digital and analogue signals while recording and corelating the program execution at the same time. This makes it possible to test very close to reality and as early as possible during software development. All realized from the known environment, almost on-the-fly and without learning a new methodology.
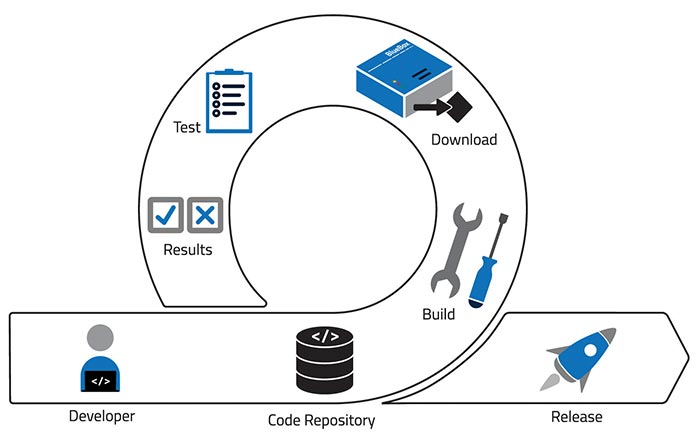
Figure 5: The pipeline of a Continuous Integration infrastructure with build, static analyses, unit tests, system tests, and finally a deliverable product. (© iSYSTEM)
A typical use case of these flexible interfaces for test automation is Continuous Integration (CI). CI supports agile/distributed software development and test by integrating the changes or newly created code by developers into a repository shared with the team at short intervals. There are several suitable Continuous Integration servers for this purpose, such as Jenkins, GitLab, TeamCity, CircleCI or GitHub Actions. With integration, a rapid and highly automated series of steps – called a “pipeline” – is triggered via CI software hosted in-house or in the cloud. The pipeline usually includes and combines the build, static analysis, unit and system tests.
The classic debugger thus becomes a test tool for tests on the real hardware.
Generally, software can also be subjected to extensive tests on a PC platform, independently of the target hardware. Nevertheless, not all potential errors are detected in simulated environments: for example, the required hardware periphery is often not available, or the application does not behave the same as on real hardware, the timing behavior is different, or the cross-compiler generates target-specific object code and thus not the same code as the compiler used for the test environment. Therefore, it makes sense to test as close as possible to the real hardware at an early stage to ensure the correct function of the final product as well as the exact timing behavior of the application.
Safety standards such as ISO26262 and DO-178C have an influence on the functional scope of tools and on the provision of proof of the correctness of these functions to the customer. Particularly in aviation, tool manufacturers have been required to cooperate in terms of tool qualification for quite some time – but also more recently in the automotive industry with ISO26262. To this end, tool manufacturers must create verification options for the functional correctness of the tools used in relation to specific use cases. These can be organizational measures, for example external audits of the development process or certification of the tools by independent third parties, or reference tool suites that support the customer in carrying out the proof of correctness. The methods described above for automating test procedures using debuggers are very well suited for implementing such tool qualification processes.
Conclusion
The debugger is more and more turning into a process tool. The basic functions of a debugger find their ordinary application and are supplemented by powerful analysis functions. The increasing complexity of software, the vast number of software and hardware tools used in software development itself, and their interdependencies, drive the need for knowledge transfer and consulting services between tool manufacturers, chip suppliers and customers. A continuous and open communication between all parties involved in these developments is the key to success. Already today, customers no longer want to buy tools, they want to use them whenever and wherever those are needed. New business models for embedded software development and software testing will come into play where tools, knowledge transfer and consultancy are a common product and ultimately a service. Just like in the software industry, the subscription business model is most appropriate for global embedded software development and testing.
 Author: Erol Simsek
CEO al iSYSTEM,
a privately held company that develops and manufactures tools and solutions for embedded software development and testing.