


![]() Introduction
Introduction
Traditionally, peripheral blood oxygen saturation (SpO2) is a measurement taken at the peripherals of the body on the finger or ear, most commonly with a clip device to determine the ratio of oxygen saturated hemoglobin to total hemoglobin. This measurement is used to tell how well red blood cells are transporting oxygen from the lungs to other parts of the body. Normal SpO2 levels vary from 95% to 100% in a healthy adult. Levels below this range indicate a condition known as hypoxemia. This means that the body is not transporting enough oxygen to maintain healthy organs and cognitive function.
A person suffering from hypoxemia may experience dizziness, confusion, shortness of breath, and headaches. Several medical conditions can cause poor blood oxygenation and may require continuous or intermittent monitoring at home or in a clinical setting.
SpO2 is one of the most common vital signs recorded within a clinical setting. Some conditions that require continuous SpO2 monitoring include asthma, heart disease, COPD, lung disease, pneumonia, and COVID-19 induced hypoxia.
One of the ways to determine whether symptomatic COVID-19 patients need hospitalization is by monitoring their SpO2 levels. If those levels fall below the baseline number (usually under 92%), they need to be checked into an emergency room.
The Recent Link Between COVID-19 and Hypoxia
Very recently, COVID-19 patients have been diagnosed with a particularly insidious condition known as silent hypoxia. Silent hypoxia can do severe damage to the body before any of the typical COVID-19 respiratory symptoms, like shortness of breath, occur. An article on the National Center for Biotechnology Information website1 states “the ability to detect this silent form of hypoxia in COVID-19 patients before they begin to experience shortness of breath is critical for preventing the pneumonia from progressing to a dangerous level.”
SpO2 monitoring is also a key indicator in diagnosing sleep apnea. Obstructive sleep apnea causes the airways to become partially or fully blocked during sleep. This can be observed as long pauses in breathing or periods of shallow breathing causing temporary hypoxia. If untreated over time, sleep apnea can increase the likelihood of heart attack, stroke, and obesity. It is estimated that sleep apnea affects between 1% to 6% of the total adult population.
The Urgent Need for a Better Pulse Oximeter Now and in the Future
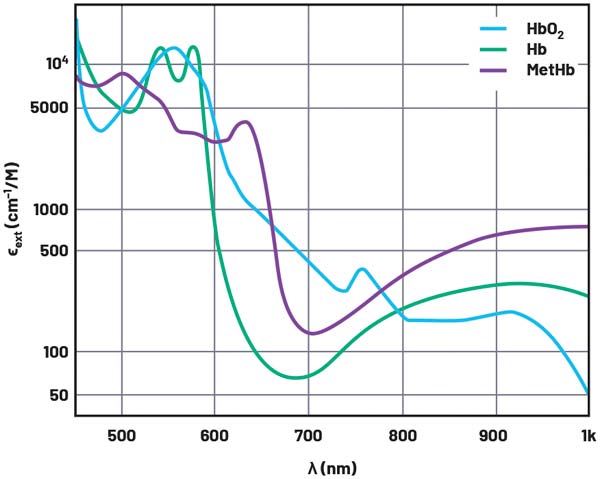
Figure 1. Extinction factor of light through hemoglobin.
As patient care trends toward ambulatory and in-home monitoring, there is a need to develop vital sign monitoring devices that will not impede users from completing daily tasks. In the case of SpO2, monitoring areas other than the finger and ear will present a host of design challenges. The recent emergence of silent hypoxia makes the case for development of more portable clinical-grade pulse oximeter units even more compelling.
This article will explain some of the fundamental principles of SpO2 measurement and introduce ADI’s latest generation of optical AFEs, the ADPD4100 and ADPD4101, which reduce design complexities for medical grade SpO2 devices. Built-in high performance automatic ambient light rejection reduces the burden on mechanical and electronic design. The high dynamic range in the ADPD4100 at lower power consumption reduces the number of photodiodes or LED current in a design to determine slight variations in patient SpO2 level efficiently. Finally, digital integrator options allow users to enter an extremely efficient power consumption mode to enable longer run times in portable PPG solutions by disabling analog blocks in the optical signal path.
What Is Oxygen Saturation?
Oxygen saturation is the percentage of oxygen saturated hemoglobin within the blood with respect to the total available hemoglobin. The gold standard for measuring oxygen saturation is the atrial blood oxygenation measurement, SaO2. However, this method requires laboratory-based blood gas analysis of a blood sample. The calibration section covers this in greater depth.
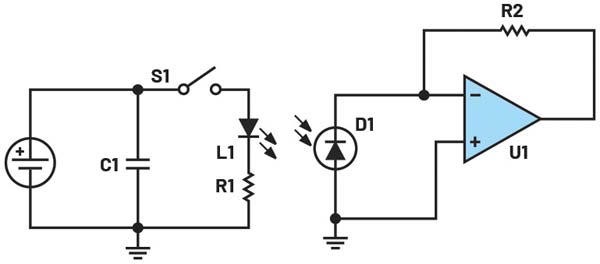
Figure 2. Basic pulse oximeter circuit.
SpO2 is an estimate of the oxygen saturation levels measured at the peripherals of the body, using a pulse oximeter. Until recently, the most common way to measure oxygen saturation has been to use a pulse oximeter positioned on the finger.
How Does a Pulse Oximeter Work?
A pulse oximeter works on the principal that absorption of light in oxygenated hemoglobin (HbO2) and deoxygenated hemoglobin (RHb) differ significantly at specific light wavelengths. Figure 1 shows the extinction coefficient of HbO2, Hb, and methemoglobin (MetHb) across the visible and infrared light spectrum. The extinction coefficient is a measurement of how strongly a chemical substance absorbs light at a given wavelength. From Figure 1, it can be seen that HbO2 absorbs more red light (600 nm) and allows more infrared light (940 nm) to pass through. RHb absorbs more light at infrared wavelengths, which allows more red light to pass through than in HbO2.
The most basic pulse oximeter consists of two LED (one red 660 nm LED and one infrared (IR) 940 nm LED) and a single photodiode (PD) in a reflective or transmissive configuration (see Figure 4). The pulse oximeter will pulse the red LED and measure the resulting signal on the PD. Repeat this for the IR LED and finally with both LEDs off to get a baseline for any ambient external light sources. This generates a photoplethysmography (PPG) signal for both wavelengths.
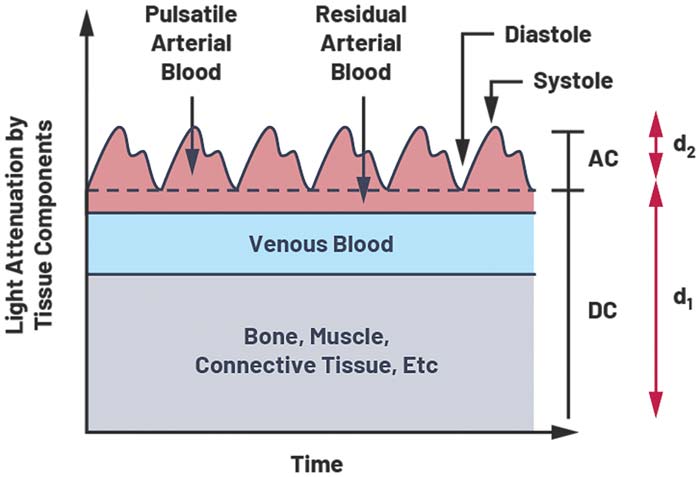
Figure 3. Light attenuation through tissue.
The signal contains DC and AC components. The DC component is due to constant reflective matter such as skin, muscle and bone, and venous blood. When a body is at rest and motion is less of a factor, the AC component comprises mainly of reflected light from the pulsation of artery blood. The AC component depends on heart rate and artery thickness, with more reflected or transmitted light in systolic (pump) than the dystopic (relaxation). During the systolic phase, blood is pumped from the heart, which increases atrial blood pressure. The increase in blood pressure expands the arteries and leads to an increase in atrial blood volume. This increase in blood causes an increase in light absorption. Blood pressure drops during the diastolic phase and therefore so does the absorption of light. Figure 3 shows the diastolic trough and systolic peaks caused by the beating heart.
![]()
![]()
The Beer-Lambert law explains that light decays exponentially when travelling though absorptive material. This can be used to determine the level of oxygenated hemoglobin to total hemoglobin.
The intensity of light absorbed at the diastole and systole are related by:
![]()
Where α measures the absorption rate of light in atrial blood and d2 is the AC amplitude of the PPG signal (see Figure 3). Idiastole is equal to the DC component labelled d1.

By computing AC and DC from a PPG signal, we are able to determine the change in absorption of light in atrial blood –α.d2 caused by blood pumping from the heart, with no contribution from other tissue.
The ratio of the AC component to the DC component is known as the perfusion index, which is the ratio of the pulsating blood flow to the nonpulsatile static blood flow. The goal of a PPG-based heart rate or SpO2 measurement system is to increase the AC to DC signal ratio.
PI = AC/DC
The perfusion index for infrared and red wavelengths can be used to calculate the ratio of ratios (RoR), which is the ratio of PIred to PLir. As the absorption of the light at a given wavelength is proportional to the
![]()
In theory, the RoR can be substituted into the following formula to compute SpO2:
Where: EHbO2,red = extinction coefficient of HbO2 at 600 nm, EHbO2,ired = extinction coefficient of HbO2 at 940 nm
ERHb,ired = extinction coefficient of RHb at 940 nm, ERHb,red = extinction coefficient of RHb at 600 nm
However, the Beer-Lambert law cannot be used directly as there are a number of variable factors in every optical design that cause variations to the RoR to SpO2 relationship. These include mechanical baffle design, LED to PD spacing, electronic and mechanical ambient light rejection, PD gain errors, and many more.
To obtain clinical grade accuracy from a PPG-based SpO2 pulse oximeter, a lookup table or algorithm must be developed for the correlation between RoR and SpO2.
Calibration
Calibration of the measurement system is required to develop a high accuracy SpO2 algorithm. To calibrate an SpO2 system, a study must be completed where a participant’s blood oxygen levels are medically reduced, monitored, and overseen by a medical professional. This is known as a hypoxia study.
The SpO2 measurement system can only be as accurate as the reference. Reference options include medical grade finger clip pulse oximeters and the gold standard co-oximeter. The co-oximeter is an invasive method of measuring the oxygen saturation of blood that yields high accuracy, but in most cases is not convenient to administer.
The calibration process is used to generate a best fit curve of RoR value calculated from the optical SpO2 device to the co-oximeter SaO2 measurement. This curve is used to generate a lookup table or equation for calculating SpO2.
Calibration will be required for all SpO2 designs as RoR is dependent on a number of variables such as LED wavelength and intensity, PD response, body placement, and ambient light rejection, which will differ with each design.
An increased perfusion index and, in turn, a high AC dynamic range on the red and IR wavelengths will increase the sensitivity of the RoR calculation and, in turn, return a more accurate SpO2 measurement.
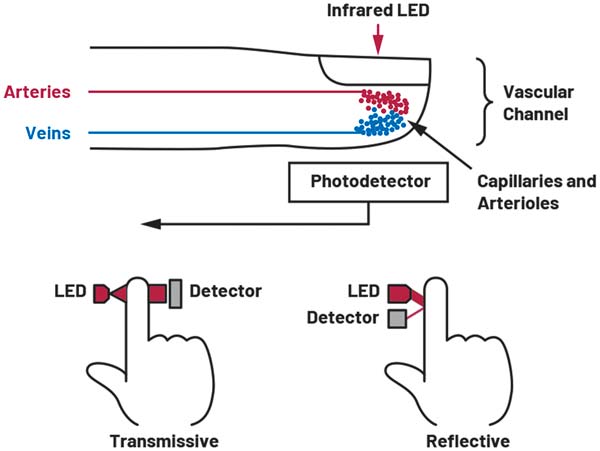
Figure 4. LED-PD configuration.
During a hypoxia study, 200 measurements equally spaced between 100% and 70% blood oxygen saturation need to be recorded. Subjects are chosen with a variety of colored skin tone, and an equal spread of age and gender. This variation in skin tone, age, and gender accounts for differing perfusion index results from a spread of individuals.
The overall error for transmissive pulse oximeters must be ≤3.0% and ≤3.5% for reflective configuration.
Design Considerations:
Transmissive vs. Reflective
A PPG signal can be obtained using a transmissive or reflective LED and PD configuration. A transmissive configuration measures the nonabsorbed light passed through a part of the body. This configuration is best suited to areas such as the finger and earlobe where measurement benefits from the capillary density of these body locations, which make the measurements more stable, repetitive, and less sensitive to variations in placement. Transmissive configurations achieve a 40 dB to 60 dB increase in the perfusion index.
Reflective PPG configurations are chosen when the PD and LED must be placed next to each other for practicality, such as with wrist- or chest-worn devices.
Sensor Positioning and Perfusion Index
Positioning on the wrist and chest require greater dynamic range in the PPG AFE as the DC signal is greatly increased due to the depth of the arteries below static reflective components such as skin, fat, and bone.
Greater resolution in the PPG measurements will reduce the uncertainty in the SpO2 algorithm. With a typical PI of 1% to 2% for wrist-worn SpO2 sensors, the goal of pulse oximeter design is to increase the PI through mechanical design or to increase the dynamic range.
The spacing of the LED to PD will have a major effect on the PI. Too little spacing will increase LED to PD crosstalk or backscatter. This will appear as a DC signal and saturate the AFE.
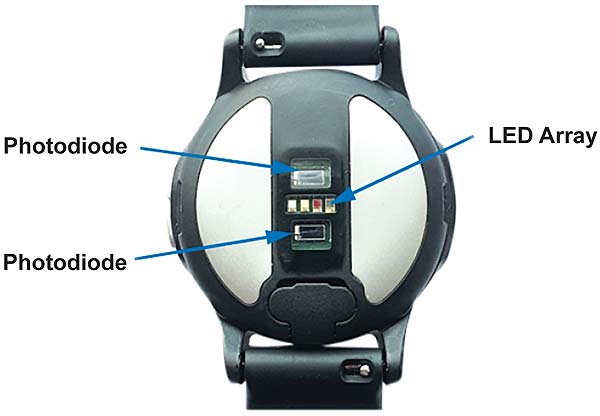
Figure 5. ADI VSM watch V4, baffle, and LED DP array
Increasing this spacing reduces the effect of both backscatter and crosstalk but also reduces the current transformer ratio (CTR), which is the LED output to PD return current. This will affect the efficiency of the PPG system and require greater LED power to maximize the AFE dynamic range.
Rapidly pulsing one or multiple LEDs has the benefit of reducing the 1/f noise contribution to the overall signal. Pulsing the LEDs also makes it possible to use synchronized modulation at the receive side to cancel out ambient light interferers. Integrating multiple pulses increases the PD signal amplitude and lowers the average current consumption. Increasing the total PD area also increases CTR as more of the reflective light is captured.
For heart rate PPG measurement, a combination of a single large PD and multiple power efficient green LEDs has been adopted by many HR device manufacturers to be used on places where there is limited blood flow. Green LEDs are chosen due to their high rejection of motion artifacts.2 However, this comes at the cost of power. Green LEDs have a higher forward voltage than red and IR and high absorbance in human tissue, meaning a higher LED power is required to return meaningful cardiac information.
As SpO2 requires multiple wavelengths and most systems still incorporate high efficiency green LEDs for the HR PPG, the most common configuration for HR and SpO2 PPG systems is a single green, red, and IR LED array surrounded by multiple PDs, as seen on the ADI VSM watch in Figure 5. PD to LED spacing has been optimized to reduce backscatter and the baffle design reduces LED to PD crosstalk.
Multiple prototypes of the ADI VSM watch were trialed to verify the most efficient PD to LED spacing for our HR PPG and SpO2 measurement.
Motion Artifacts
Motion artifacts provide one of the greatest design challenges to a PPG measurement system. When motion is present, the width of the arteries and veins change due to pressure. The amount of light absorbed by the photodiode changes and this is present on the PPG signal because photons are absorbed or reflected differently than when a body is at rest.
For an infinitely wide photodiode area covering an infinitely long deep tissue sample, all photons will eventually be reflected to the photodiode. In this case, no artifact due to motion will be detected. This, however, cannot be achieved; the solution is to increase the photodiode area while taking capacitance into account—lowering AFE and providing filtering for motion artifacts.
The normal frequency for a PPG signal is between 0.5 Hz to 5 Hz while motion artefacts are typically between 0.01 Hz to 10 Hz. Simple band-pass filtering techniques cannot be used to remove motion artifacts from the PPG signal. To achieve high accuracy motion cancellation, an adaptive filter needs to be supplied with highly accurate motion data. For this purpose, Analog Devices has developed the ADXL362 3-axis accelerometer. This accelerometer provides 1 mg resolution with up to 8 g of range while consuming only 3.6 μW at 100 Hz and is available in a 3 mm × 3 mm package.
ADI Solution: ADPD4100
The positioning of the pulse oximeter generates several challenges. Wrist-worn SpO2 devices provide additional design challenges as the AC signal of interest is only 1% to 2% of the total received light on the PD. To achieve medical grade certification and distinguish between slight variations in oxyhemoglobin levels, a higher dynamic range on the AC signal is required. This can be achieved by reducing ambient light interference and decreasing LED driver and AFE noise. ADI has addressed this problem with the ADPD4100.
The ADPD4100 and ADPD41001 achieve up to 100 dB SNR. This increased dynamic range is essential to measure SpO2 under low perfusion scenarios. This integrated optical AFE has eight onboard low noise current sources and eight separate PD inputs. The digital timing controller has 12 programmable timing slots that enable the user to define an array of PD and LED sequences with specific LED current, analog and digital filtering, integration options, and timing constraints.
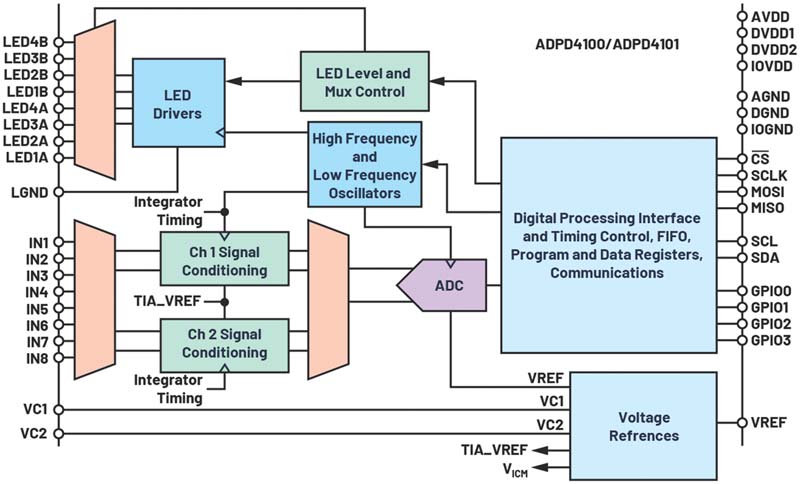
Figure 6. ADPD410X block diagram.
A key benefit of the ADPD4100 is the increase in SNR/μW, which is an important parameter for battery-powered continuous monitoring. This key metric has been addressed by increasing the AFE dynamic range while also lowering the AFE current consumption. The ADPD4100 now boasts a total power consumption of only 30 μW for a 75 dB, 25 Hz continuous PPG measurement including the LED supply. Increasing the number of pulses per sample (n) will result in a (√n) increase in SNR while increasing the LED drive current will have a proportional increase in SNR. 1 μW total system consumption will return 93 dB SNR for a continuous PPG measurement using a 4 V LED supply.
Automatic ambient light rejection reduces the burden on the host microprocessor while achieving 60 dB of light rejection. This is achieved using LED pulses as fast as 1 μs in conjunction with a band-pass filter to reject interference. In certain operating modes, the ADPD4100 automatically calculates the photodiode dark current or LED off state. This result is subtracted from the LED on state before conversion in the ADC to remove ambient light as well as gain errors and drift within the photodiode.
The ADPD4100 is supported with the EVAL-ADPD4100-4101 wearable evaluation kit along with the ADI Vital Signs Monitoring Study Watch. This hardware seamlessly connects to the ADI Wavetool application to enable bioimpedance, ECG, PPG heart rate, and multiwavelength PPG measurements for SpO2 development.
Embedded in the study watch is an automatic gain control (AGC) algorithm for the ADPD4100 that tunes the TIA gain and LED current to deliver optimum AC signal dynamic range for all LED wavelengths selected.
Alternative ADI Solutions
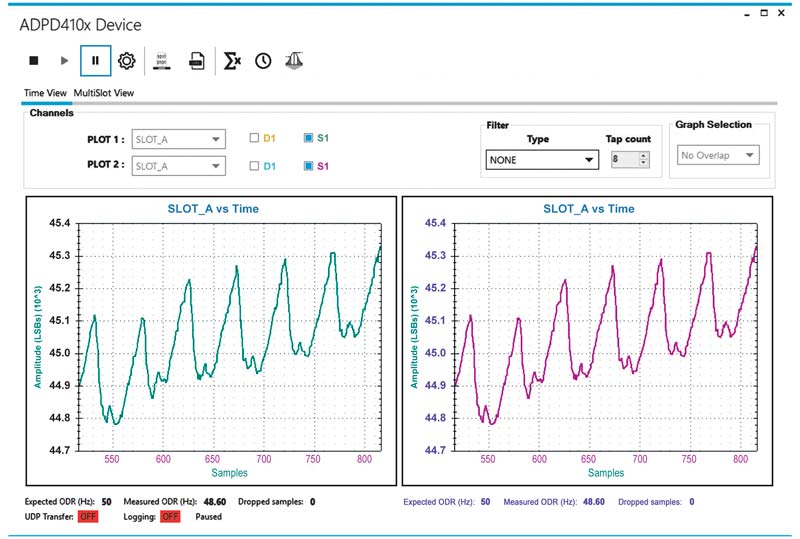
Figure 7. ADPD4100 simultaneous red (right) and IR (left) PPG measurement.
Finger- and earlobe-based SpO2 readings are the easiest to design for as the signal-to-noise ratio is higher than wrist- or chest-based positioning due to the reduction in bone and tissue, which also reduces the DC component contribution.
For such applications, the ADPD144RI module and the ADPD1080 are suitable devices.
The ADPD144RI is a complete module with an integrated red 660 nm LED and 880 nm IR LED and four PDs in a 2.8 mm × 5 mm package. The spacing between the LEDs and PD have been optimized to give the best signal-to-noise ratio for SpO2 high accuracy PPG measurements. This module allows users to quickly skip the design challenges associated with LED and PD placement and spacing to achieve optimal power to noise ratios. The ADPD144RI mechanically has been optimized to reduce optical crosstalk as much as possible. This provides a solid solution, even when the sensor is placed under a single glass window.
The ADPD1080 is an integrated optical AFE with three LED drive channels and two PD current input channels in a 17-ball, 2.5 mm × 1.4 mm WLLCSP. This AFE is ideal for custom design low channel count PPG products where board space is critical.
References
1Toshiyo Tamura. “Current Progress of Photoplethysmography and SpO2 for Health Monitoring.” Biomedical Engineering Letters, February 2019.
2Jihyoung Lee, Kenta Matsumura, Ken-Ichi Yamakoshi, Peter Rolfe, Shinobu Tanaka, and Takehiro Yamakoshi. “Comparison Between Red Green and Blue Light Reflection Photoplethysmography for Heart Rate Monitoring During Motion.” 2013 35th Annual International Conference of the IEEE Engineering in Medicine and Biology Society (EMBC), July 2013.
Author: Robert Finnerty, Systems Applications Engineer
About the Author: Robert Finnerty is a systems applications engineer working in the Digital Healthcare Group based in Limerick, Ireland. He works closely with the Vital Signs Monitoring Group, focusing on optical and impedance measurement solutions. Rob joined the precision converters group within ADI in 2012 and has focused on low bandwidth precision measurement. He holds a bachelor’s degree in electronic and electrical engineering (B.E.E.E) from National University of Ireland Galway (NUIG). He can be reached at rob.finnerty@analog.com.
![]()
Visit: https://ez.analog.com
Contact Romania:
Email: inforomania@arroweurope.com
Mobil: +40 731 016 104
Arrow Electronics | https://www.arrow.com
![]()