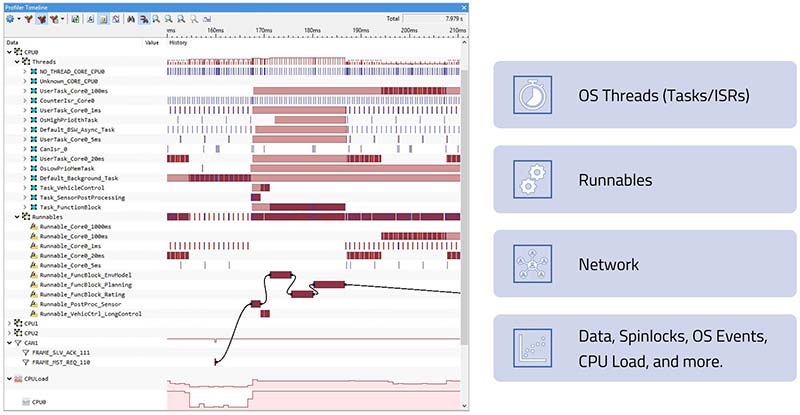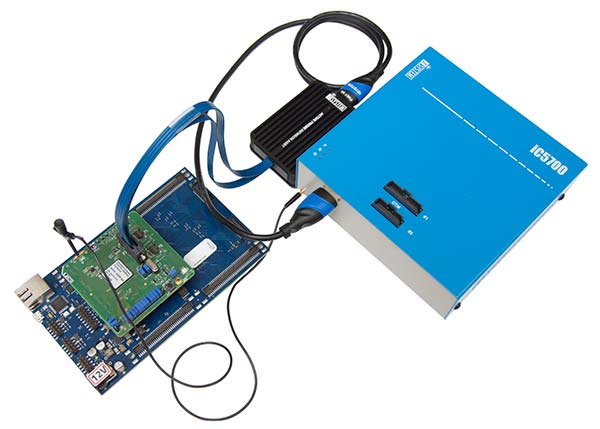
Figure 1: Recorded run-time information in the iSYSTEM Software Analyzer winIDEA allows for further analysis
For many years, iSYSTEM has been supporting the Best Trace Format (BTF) standard in its software analyzer winIDEA. Such a format is important to both, visualize data in an analysis tool and to export that data in a standardized form for further analysis in additional tools. As of now, the iSYSTEM tool also supports AUTOSAR Run-Time Interface (ARTI) and the popular storage-efficient binary trace format ASAM ARTI MDF (Measurement Data Format).
Understanding the runtime behavior of an embedded application is crucial to optimizing resource utilization and performance and ultimately meeting all safety requirements. Some of the most common features within a software analyzer, such as iSYSTEM winIDEA, are CPU load analysis, measurement of execution times, and verification of timing requirements. To achieve that, a user must record low level hardware events – we call that tracing – and process the trace data into high level system events – we call that profiling. A user usually wants to profile at least OS (Operating System) Threads – threads mean tasks and ISRs (Interrupt Service Routines). In addition to threads, there are other objects of interest, such as AUTOSAR Runnables, OS Spinlocks, and possibly even network events. Ultimately, the user receives the data in visualized form (see fig. 1), gaining full insight into the runtime behavior of threads, runnables, CAN traffic, and an expressive visualization of CPU load over time.
In the context of the AUTOSAR ARTI project, MDF has been extended with support for AUTOSAR OS and RTE (Run Time Environment) objects, as well as user customizable signals. With winIDEA supporting ASAM ARTI MDF4, embedded software developers can analyze their application’s recorded run-time information, create reports, or export the trace data for further processing in third-party timing-analysis tools for use cases such as event-chain analysis, and constraint validation. The main advantage of MDF4 is that it is already used intensively in various domains, so you can easily combine your thread and runnable traces with measurement and calibration data recorded with other tools.
Inside AUTOSAR ARTI
AUTOSAR ARTI uses a similar approach to its predecessor ORTI (OSEK Run-Time Interface) standard but extends the trace capabilities and heals some deficits of the ORTI file based AUTOSAR analysis. With ORTI, the engineer amongst others is not able to distinguish between task termination, preemption and waiting, as the OS only signals the currently running task, and cannot conduct a detailed timing analysis like activation delays or total response time. In addition, runnables are not covered by the ORTI file, same as the communication between software components. The ORTI file-based timing analysis focuses on the OS but ignores other AUTOSAR modules such as Software Components (SWCs) and Run-Time Environment (RTE). The scheduling of the AUTOSAR Runnables (by means of OS tasks) is often the relevant subject of timing analysis.
AUTOSAR ARTI however provides extended information e.g., about tasks, ISRs, runnables, RTE communication, or spinlocks in an ARXML format. ASAM ARTI aligns with AUTOSAR ARTI and defines the complementary data exchange formats relevant for debugging, tracing and analyzing. iSYSTEM’s winIDEA fully supports the import of ARXML which enables detailed run-time evaluation, tracing, and statistical analysis of the AUTOSAR OS and RTE.
Further Links and Resources
- Specification of AUTOSAR Run-Time Interface: https://www.autosar.org/fileadmin/user_upload/standards/classic/21-11/AUTOSAR_SWS_ClassicPlatformARTI.pdf
- ASAM ARTI MDF: https://www.asam.net/standards/detail/arti/
- iSYSTEM AUTOSAR Support: https://www.isystem.com/products/id-3rd-party-software-support/autosar.html
- iSYSTEM Profiler Packages: https://www.isystem.com/products/solutions/autosar/profiler-packages.html
- iSYSTEM Webinar: Trace-Based Vector MICROSAR Timing Analysis 2022 Edition: https://youtu.be/y69Zf5TgYAQ


