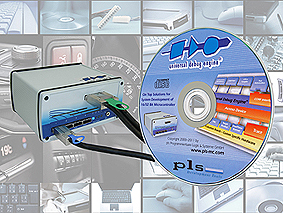
PLS Programmierbare Logik & Systeme presents its Universal Debug Engine (UDE) 3.0 in Hall A10, Booth A10.215 at embedded world 2011 in Nuremberg from 1 to 3 March 2011. The UDE 3.0 features unique visualization capabilities, an enhanced Eclipse integration and extensive dedicated support for a wide range of popular high-end microcontroller architectures.
One of the new features of the UDE 3.0 is that program trace data can also be displayed as execution sequence diagram. Furthermore, a direct synchronization with the source code is possible with a mouse click. In addition, the resolution was drastically increased for the graphical representation and ranges from nanoseconds for the hardware-based trace all the way to hours.
The new ‘Band’ display mode improves the overview of large data sets. Besides the PC time as X axis, an appropriate variable from the target, for example system tick, can now also deliver time information. Once defined variable expressions are program-wide useable via a global expression clipboard.
Microcontrollers supported by the UDE 3.0 include, among others, Infineon’s new TC1791, TC1793 and TC1798 AUDO MAX devices, based on the TriCore™ version 1.6. The emulation devices of this high-end MCU family, which are specifically designed for troubleshooting and calibration, offer the user significantly advanced diagnostic capabilities in combination with the further improved Universal Emulation Configurator (UEC) of the UDE 3.0. For example, the newly introduced delta comparators allow an easy monitoring of value changes of application variables. Thanks to the arbitration support, the UDE 3.0 is usable together with commonly available calibration tools. Furthermore, the UDE 3.0 is also part of the Eclipse-based ‘TriCore Development Platform’, which was jointly designed by PLS and HighTec.
The UDE 3.0 also offers some interesting architecture-specific features, for instance with regard to the latest 16-bit MCUs of Infineon’s XC2000/XE166 family. On the one hand, the UDE 3.0 supports debugging of applications in cached memory areas. On the other hand, the Universal Emulation Configurator (UEC) of the UDE allows a simple recording of program and data flows when using an XC2000ED Emulation Device as well as a targeted observation of all relevant system operations on the chip. This also enables difficult to locate, application-specific errors to be found quickly.
The latest version of the Universal Debug Engine also promises dedicated support for the Power Architecture based SPC56 family from STMicroelectronics and the Qorivva MPC55xx and MPC56xx series from Freescale. With the UDE 3.0, for instance, derivatives with dual e200 cores such as the SPC56EL or MPC5643L can be debugged both in the safety-relevant Lockstep Mode (LS Mode or LSM) and the Decoupled Parallel Mode (DP Mode or DPM). In addition, a complete Eclipse-based development environment is provided to developers with the ‘Power Architecture Development Platform’.
Last but not least, the UDE 3.0 also supports a variety of Cortex-M0, Cortex-M3 and Cortex-M4 derivatives of different manufacturers, whereby all CoreSight technologies such as Serial Wire Debug (SWD), Serial Wire Viewer (SWV), Instrumentation Trace Macrocell (ITM) and Enhanced Trace Macrocell (ETM) are used by the debugger. Examples of this are the Cortex-M3 based AT91SAM3 MCU from Atmel, the EFM32 devices from Energy Micro, the LPC11xx/LPC17xx families from NXP, the Stellaris microcontrollers from Texas Instruments and the TMPM3x0 series from Toshiba.
The Universal Debug Engine 3.0 is available for all 32-bit and 64-bit versions from Windows XP to Windows 7 and can be integrated at no extra cost in Eclipse environments based on Ganymede 3.4.x, Galileo 3.5.x and Helios 3.6 with the appropriate C/C++-IDE (CDT 5.0.x,6.0,7.0). Access to the target takes place via the supplementary Universal Access Devices UAD2 and UAD3+ from PLS, whereby the UAD3+ enables the user multi-target support with debug clock rates of up to 100 MHz, up to 4 GByte trace memory (Nexus, CoreSight ETM) and recording of trace signals to 500 MHz.
www.pls mc.com


