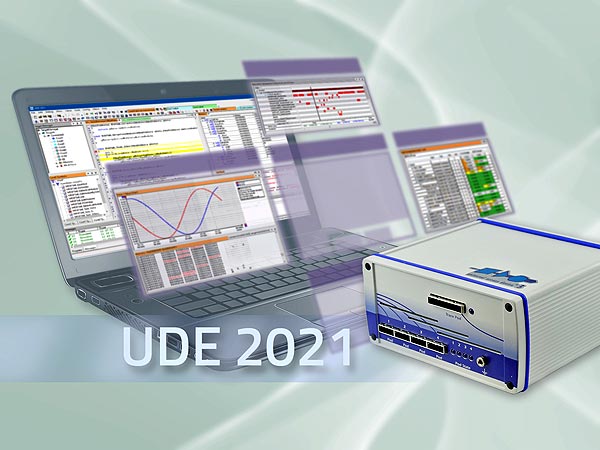
 A new intuitive user interface that allows even more efficient debugging of highly complex, next-generation multi-core systems is offered by UDE 2021, which PLS Programmierbare Logik & Systeme will be presenting at embedded world 2021 DIGITAL. For a significant improvement in automated testing, the code coverage functions have also been optimized and a Python console is implemented in the current version of the Universal Debug Engine (UDE).
To make analysis and debugging of applications running on microcontrollers and processors with an ever-increasing number of cores even more efficient, PLS is using a completely new layout framework in the UDE 2021. In contrast to the previous layout with fixed dock locations left, right, top and bottom and a central tab window in which windows were accessible via tabs, all windows in the debugger – which, for example, display the source code, internal states such as variables or registers, or also provide graphical visualizations – can now be arranged and grouped completely flexibly within the UDE user interface. If required, the user can create a new dock location at any time or add a window as a new tab to an existing dock location. In addition, dock locations can also be created outside the main UDE window to accommodate single or multiple UDE windows. This allows a very convenient multi-monitor operation.
In other ways, too, UDE 2021 literally offers its users completely new perspectives. Because Perspectives allow you to define multiple views within a debugger session and switch between them to focus on a specific debugging task. They are particularly useful for multi-core debugging, when the developer wants to analyze the behavior of, for example, a core in detail. Perspectives can be created freely and debugger windows can be placed and arranged in them without restriction.
The new UDE 2021 is now running on a full 64-bit code base. This means a significantly increased performance, especially when processing large amounts of data, as occurs during trace data analysis, for example. In addition, the UDE can now also be integrated as a plug-in in the latest 64-bit Eclipse versions.
The code coverage functions of UDE 2021, which provide developers with a metric for test quality, are more comprehensive and powerful than ever. The Universal Debug Engine (UDE) relies exclusively on trace information to calculate code coverage. The big advantage over other methods is that there is no need for instrumentation of the code under test at all. The entire code coverage analysis is therefore non-invasive and does not affect the runtime behavior of the application at any time. The code coverage results are presented in compact form for all calculated coverage levels and can be clearly displayed starting from the function level down to individual instructions at the object code level. A trace recording can be conveniently filtered for interesting functions or code regions. In addition, the handling of the code coverage functions has been considerably simplified. With UDE 2021, neither explicit activation nor preselection of the desired coverage level is necessary. Generation and output of code coverage reports has also been improved and extended. Besides HTML, now also CSV, XML and plain text are available as output formats, whereby content and appearance of the reports can be easily customized according to individual needs.
As another benefit, the calculation algorithms for code coverage have been fundamentally revised, which in practice leads to a significant acceleration of the analysis. The UDE object model, the software API for scripting and tool coupling, has also been optimized concerning the code coverage. This allows third party tools, such as external test tools, to better control the code coverage provided by UDE for the evaluation of the quality of test cases, which ultimately leads to even more meaningful results.
In addition, a Python console was added to UDE. So, the popular scripting language can now not only be used for external scripting such as remote control of the UDE via a command line, but can now also be used as a command language within UDE. For example, the Python console allows users to execute functions of the Component Object Model (COM)-based UDE software API directly within UDE as Python commands. The user is supported by auto-completion and context-sensitive help. The executed commands can also be saved as a script to be able to load and run them again. An integrated script debugger is available for easy debugging of the Python scripts.
For the high-end UAD3+ access device of the Universal Access Device (UAD) family, PLS will present a new high-speed Pod for serial trace at embedded world 2021 DIGITAL. This Pod can transmit trace data from latest-generation microcontrollers, such as NXP’s S32G automotive network processor, to UDE via highest-bandwidth serial trace interfaces. Target interfaces with up to eight lanes are supported and data rates of up to 12.5 Gbit/s per lane are achieved. Furthermore, the flexible adapter concept allows easy adaptation to connectors defined by semiconductor manufacturers. The data transfer between the Pod and the UAD3+ is done via a high-performance PCI-E connection. Up to 4 GB of memory are available in the UAD3+ to store the trace data captured on the target system.
PLS Programmierbare Logik & Systeme


